
Summarize this blog post with:

If you sell on Amazon, you know exactly how the Amazon Great Indian Festival feels from the inside.
Orders pinging at midnight. The team WhatsApp group buried in fire emojis. Someone posting a screenshot of the sales dashboard at 2 am with just one word: “Insane.” For a few weeks, every number goes up and to the right.
Then the sale ends. The dashboard calms down. And in the post-sale review, the tougher questions arrive. Finance asks how much of this will actually stick. The founder asks why the ad bill looks so big. Ops asks why the bestseller went out of stock on day two. And the only number everyone really has is revenue.
Sound familiar?
It’s a moment many brands are living right now. By Amazon’s own count, the Amazon Great Indian Festival 2026 drew 440 million+ visits in its early phase alone, the highest in Amazon.in’s history, and the number of first-time Amazon.in shoppers rose by nearly 100% (About Amazon). Sellers saw 3.5X their usual sales in the first week (About Amazon). For most brands, the topline looks fantastic.
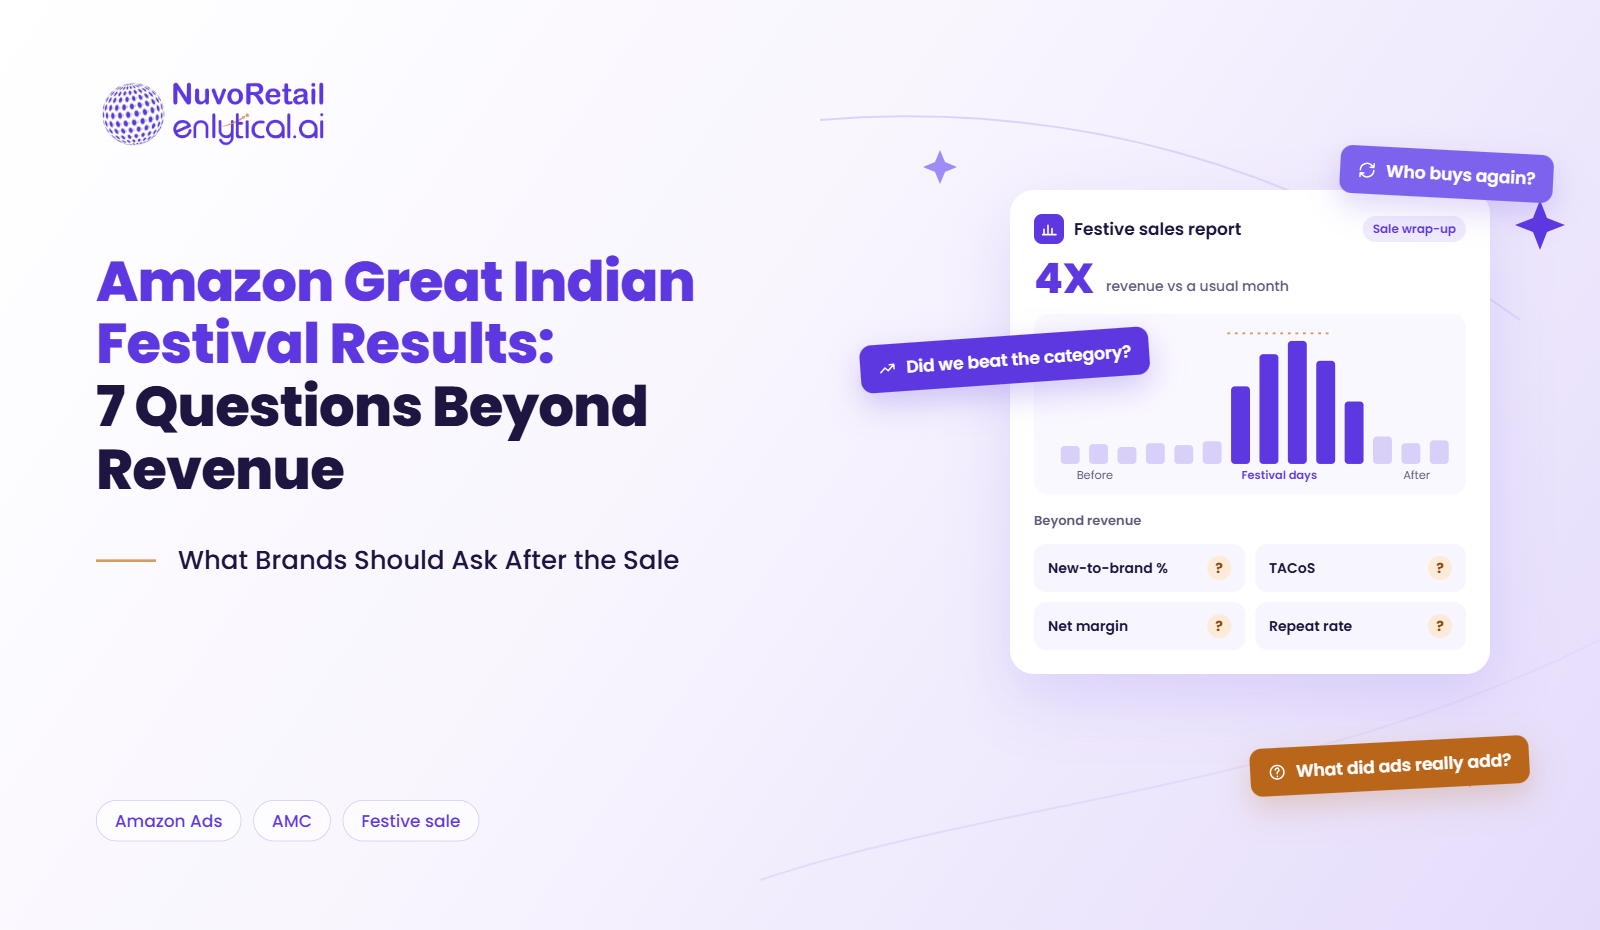
But revenue is only the first line of your Amazon Great Indian Festival results.
- 1. How many of these buyers were new to your brand?
- 2. Did you grow faster than your category?
- 3. What did each rupee of ad spend really buy?
- 4. Where did your buyers actually come from?
- 5. What was your margin after the discounts and returns?
- 6. Were you in stock and visible when it mattered?
- 7. What happens to these buyers next?
- Conclusion: The sale is over. The real work starts now.
The real story is in what sits underneath it: who bought, what it cost, and whether they’ll come back.
Well, here are TOP 7 questions we ask every brand before the celebration slide goes into the board deck.
1. How many of these buyers were new to your brand?
When the Amazon Great Indian Festival doubles first-time shoppers across the whole marketplace, a big sales number can simply mean you were in the right place. The more useful figure is your new-to-brand (NTB) share: how many buyers had never purchased from you before.
For many brands, the honest answer is humbling: a big share of festive sales comes from loyal customers who simply waited for the discount. Great revenue, but very little new growth.
Where to look: NTB orders and NTB % in Amazon Ads reports, and AMC audience segmentation to split first-time buyers from repeat ones.
2. Did you grow faster than your category?
During the Amazon Great Indian Festival, whole categories surged. Amazon said units ordered by sellers in beauty grew nearly 7X in the first 24 hours, kitchen 4.2X and wireless 3.4X. If your beauty brand grew 3X, you didn’t win. You lost share in a rising market.
Where to look: Category share in Brand Analytics, share of voice on your top search terms, and branded versus generic search trends.
3. What did each rupee of ad spend really buy?
ROAS during the Amazon Great Indian Festival always looks good, because shoppers arrive ready to buy. The harder question is incrementality: how many of those sales would have happened anyway?
This is where Amazon Marketing Cloud earns its place. AMC customer journey analysis shows which shoppers saw your video and display ads before searching for you, and which ones would have bought regardless. Pair it with TACoS (total ad spend as a share of total sales) to see whether advertising grew the business or just bought sales you’d have made anyway.
Where to look: TACoS by week, AMC path-to-purchase and overlap reports, and branded search lift among ad-exposed audiences.
4. Where did your buyers actually come from?
Over 72% of early Amazon Great Indian Festival visits came from beyond India’s top nine metros, according to Amazon. If your creatives, pack sizes and price points were built for Mumbai and Bengaluru, you may have left a lot of demand on the table.
Where to look: Sales and NTB orders by region, and which products sold best outside the metros. Those buyers are your next growth market, not just festive traffic.
5. What was your margin after the discounts and returns?
Amazon says customers saved over ₹2,800 crore during the Amazon Great Indian Festival 2026 (About Amazon). Some of that came from your margin. Add deeper discounts, coupons, higher ad costs, and the returns still arriving, and a record sales week can quietly lose money.
Where to look: Contribution margin by ASIN after discounts, fees, ad spend and returns. Rank your hero products by profit, not just revenue.
6. Were you in stock and visible when it mattered?
The best campaign in the world can’t sell an out-of-stock product. Many brands discover after the Amazon Great Indian Festival that their bestseller ran out on day two, or lost the Buy Box to a reseller during peak hours.
Where to look: Out-of-stock days by ASIN, Buy Box percentage during peak days, and search rank on your top keywords. Every lost day is a lesson for the next sale.
7. What happens to these buyers next?
Remember finance asking how much of this will stick? This is that question. Buyers from the Amazon Great Indian Festival are the warmest audience you’ll have all year, and most brands let them go cold.
AMC cohort analysis tracks whether festive buyers make a second purchase, how quickly, and what they buy next. A smart Amazon DSP retargeting strategy can then reach them with replenishment reminders, Subscribe & Save offers and complementary products, while they still remember you.
Where to look: Repeat purchase rate at 30, 60 and 90 days, and lifetime value of festive cohorts compared with buyers acquired at full price.
Your post-festival scorecard
| Question | Healthy sign |
| New-to-brand buyers | NTB share rose during the sale |
| Category growth | Your growth matched or beat your category |
| Ad efficiency | TACoS stayed stable or fell |
| Buyer geography | Tier 2 and 3 demand is visible and growing |
| Profitability | Hero products stayed margin-positive |
| Availability | No major stock-outs on top ASINs |
| Retention | A plan is in place to win the second purchase |
Frequently asked questions
How should brands measure Amazon Great Indian Festival results? Look beyond revenue to new-to-brand share, category share, TACoS, contribution margin, stock availability and repeat purchase rate. Together they show whether the sale built your business or simply moved demand forward.
What is new-to-brand (NTB) on Amazon? NTB customers are shoppers who bought from your brand for the first time in the past 12 months. NTB metrics are available in Amazon Ads reporting.
How can Amazon Marketing Cloud help after a sale? Amazon Marketing Cloud lets brands analyse anonymised shopper journeys across ads and purchases. It helps measure incrementality, segment new and repeat buyers, and build retargeting audiences from festive shoppers.
Conclusion: The sale is over. The real work starts now.
The brands that keep growing after a big sale aren’t the ones with the best screenshot. They’re the ones that walk into the post-sale review with a different slide: how many new customers they won, which products made money, and a plan to bring festive buyers back before the next sale.
That’s the shift every brand can make after the Amazon Great Indian Festival. Revenue tells you what happened. These seven questions tell you what to do next.
At NuvoRetail, this is how we approach Amazon Marketing Services: connecting Amazon Ads, Amazon DSP and Amazon Marketing Cloud into one view of growth, from first click to repeat purchase. Our analytics platform, enlytical, brings those numbers together so you can act on them, not just report them.
Want to know what your festive results really mean?
Book a post-festival Amazon review with the NuvoRetail team, and we’ll show you which numbers to celebrate, which to fix, and how to turn festive buyers into year-round customers.